Strengthening Municipal Preparedness
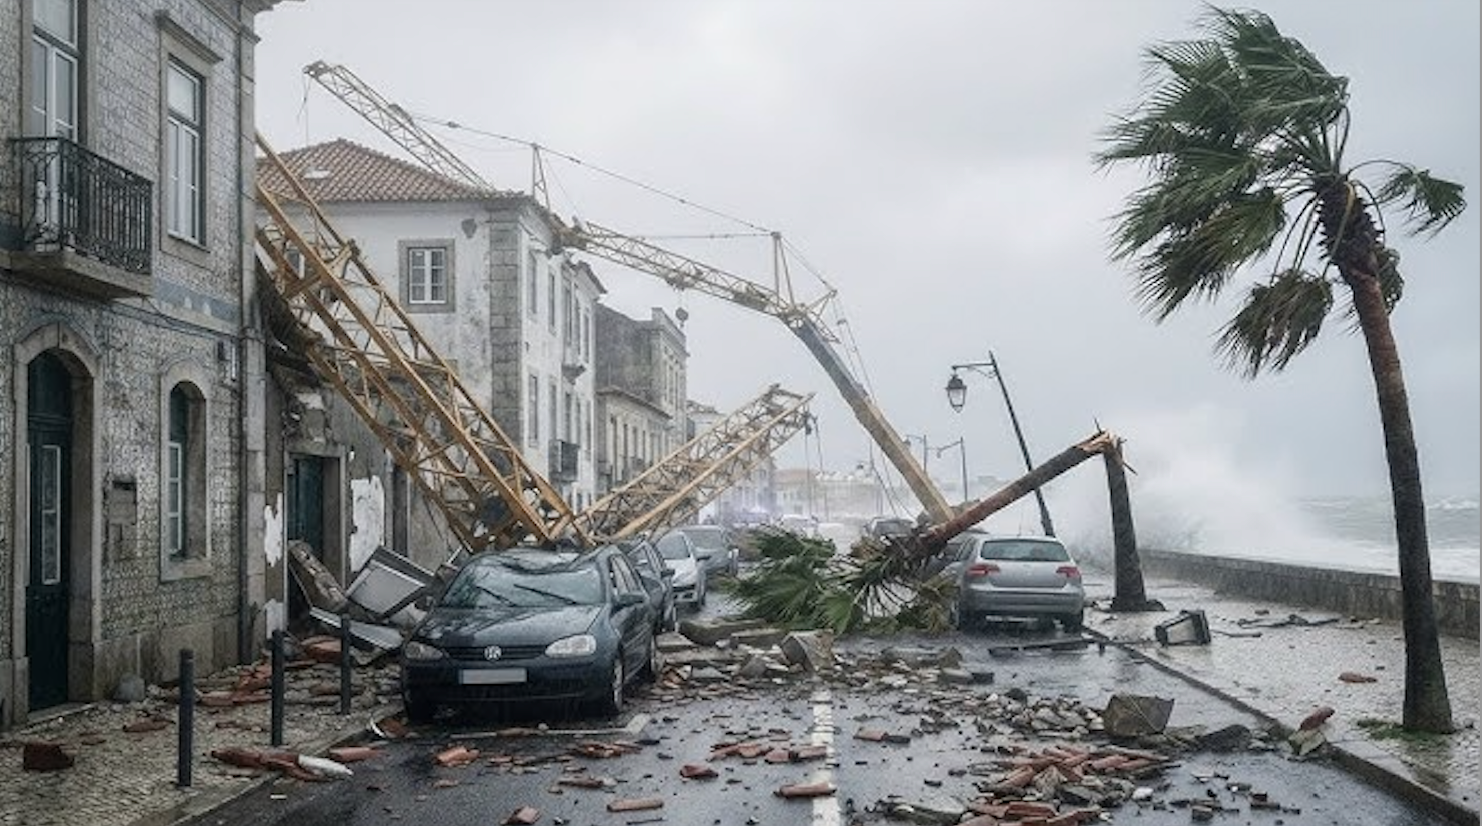
Cities and regions have always faced risks, and always needed to prepare. But now that climate change is generating such an increase in threat levels, and in threat frequency, is it time to take a fresh look at municipal risk management?
The challenge is not to create adequate documentation. If anything, there is so much documentation that the humans responsible for decision-making are struggling to process all the available Emergency Plans, Civil Protection Plans, Flood Risk Maps, Climate Adaptation Strategies, Port Authority Coordination Plans, Infrastructure Registers, After-Action Reports, and more.
The challenge is instead to help humans make best use of their knowledge, skills, and experience. We must help risk professionals process all this information easily, when funds are limited, risk responses cross boundaries, and every action must be as effective as possible.
We must make documents and data work harder – not by rewriting them, but by turning them into interactive pictures that help leaders see the full risk picture instantly, explore dependencies, and anticipate consequences.
The Challenge
Municipal risk documentation is often:
- Comprehensive but lengthy
- Stored across different departments
- Updated periodically rather than dynamically
- Designed for compliance rather than rapid operational insight
When an incident occurs — flooding, coastal surge, wildfire, infrastructure disruption — decision-makers need to understand very quickly:
- What are the key hazards?
- What can trigger them?
- What barriers are already in place?
- Where are the vulnerabilities?
- What cascading impacts should we anticipate?
Answering these questions usually requires structured workshops and manual hazard analysis that can take months to prepare. However, trustworthy AI can accelerate much of that work, using only the knowledge the municipality already holds.
Here is a simple, low-cost, low-effort approach based on Dedoctive AgenticFlow – our unique technology innovation that brings discipline, trust, and auditability to agentic AI, by wrapping any Large Language Model to deliver outputs with full confidence and accountability. Dedoctive reads huge volumes of complex information, organises it intelligently, thinks through difficult problems step-by-step, and produces professional-grade structured analysis – with full traceability to the original sources.
Step 1 – Structuring What Already Exists
First, we take municipal risk documentation and create a structured knowledge model from it. This fully automatic approach includes:
- Identifying hazards, threats, controls, assets and dependencies
- Connecting related concepts across documents
- Structuring information so it becomes searchable and navigable
- Preserving links to the original source material
Nothing new is added. No judgements are made by AI. We simply organise and connect what already exists. The result is not another report — but a living map of the municipality’s risk landscape.
Step 2 – Generating Interactive Bow-Tie Diagrams
Once structured, the system can generate interactive bow-tie diagrams, a widely used method in safety and risk management. A bow-tie visualisation shows:
- A central hazard or unwanted event
- The threats that could trigger it
- The preventive barriers already in place
- The possible consequences
- The mitigation measures that limit impact
- Escalation factors to threats and consequences
- Barriers to the escalation factors
For example, selecting Flooding might display:
- Contributing factors such as storm surge or drainage blockage
- Existing municipal mitigation measures
- Vulnerable infrastructure
- Potential secondary impacts (transport disruption, health services access, port operations)
- Relevant sections of the Civil Protection Plan
- Other information relevant to risk management, from a multitude of diverse sources.
As an example, shown below is Figure 3 (“Bowtie diagram for hazard: heavy storm and top event: pluvial floods”) from the preprint of Batalini de Macedo, M., Fava, M. C., da Silva, L. B. L., & Alencar, M. H. (2024). A Comprehensive Risk and Resilience Analysis of Urban Flood Disasters Chain Based on Bowtie Diagram and Sendai Framework. SSRN Electronic Journal. Doi: 10.2139/ssrn.5013815.
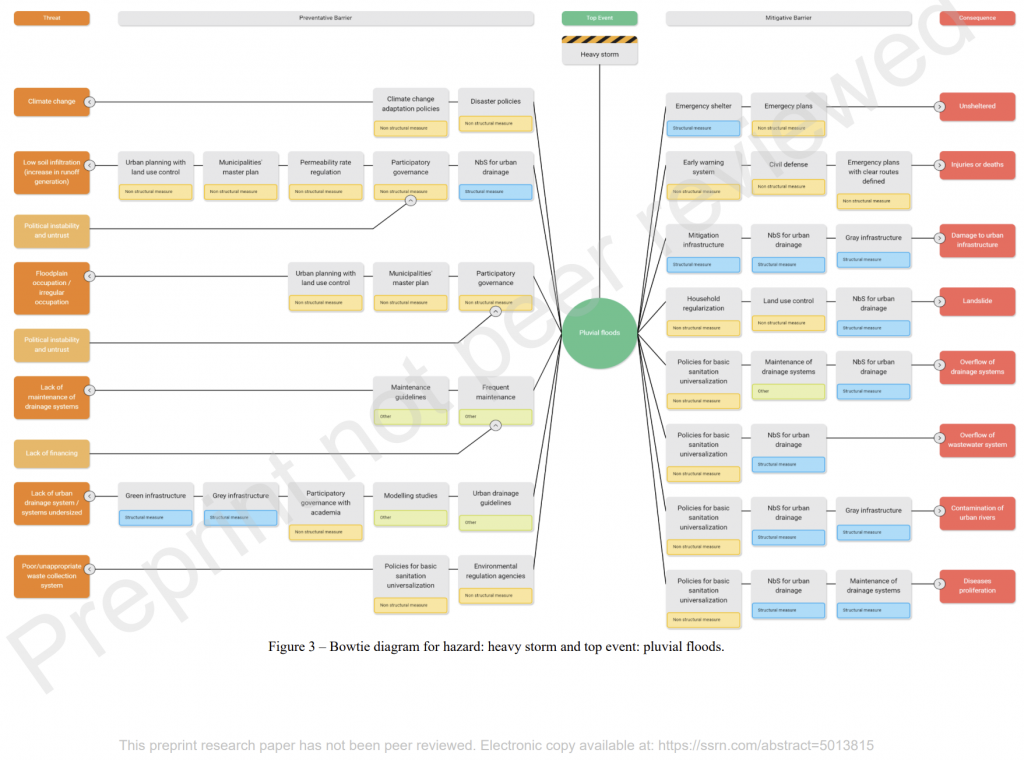
Unlike the diagram above, the bow-tie diagrams generated by Dedoctive are not static and manually created but dynamically generated on demand. They are interactive and searchable. They are hyperlinked to municipal source documents, and can be updated automatically every time the source documents change. They also include escalation factors and the associated barriers, which are missing from the example shown above.
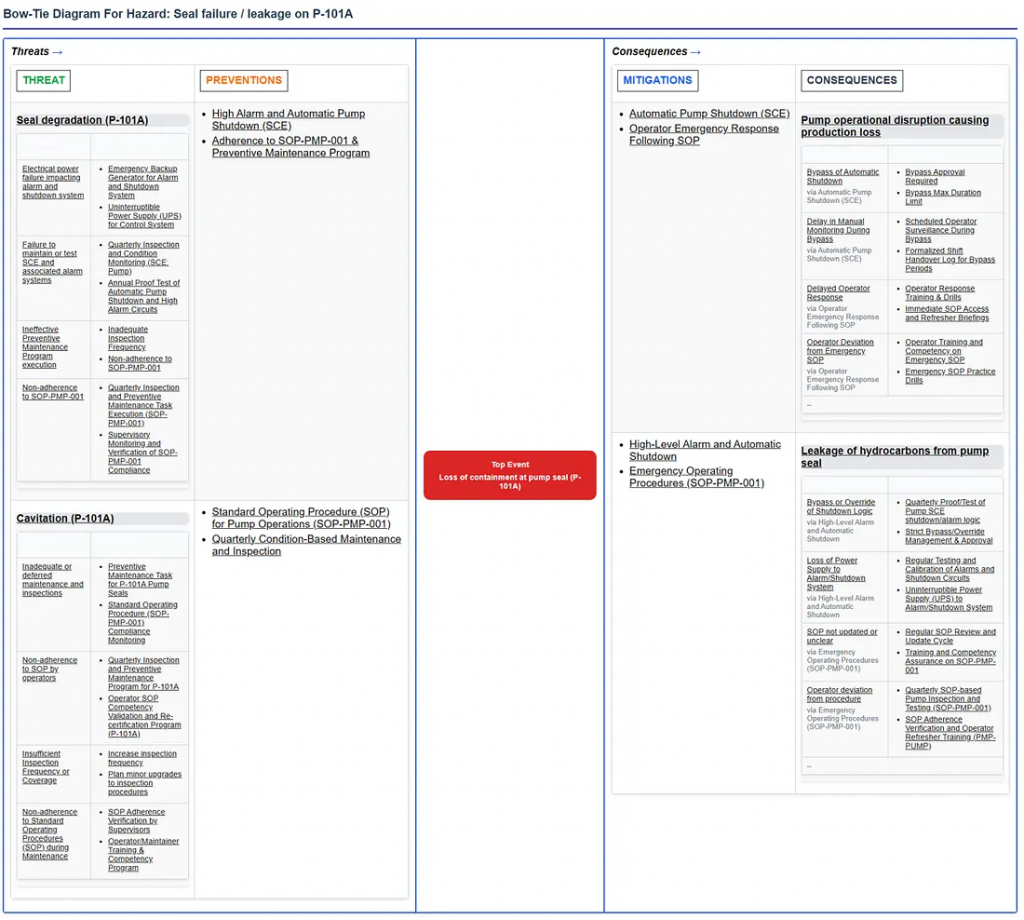
The diagrams are used in a Web browser. Each part of the diagram is linked to full details, and each detail is linked to its original source text in approved documentation (which could be a table cell or even an image). Here is an example to illustrate the format, noting that the contents are drawn from industrial engineering rather than municipal risk management.
Why This Helps
For each hazard such as Flooding, the consequences may be diverse, ranging from secondary river (fluvial) flooding to the cascading impacts of infrastructure disruption on transport, energy, communications, food supplies, healthcare, and more. By making these ripple effects visual, a bow-tie diagram helps guide and structure coordination between:
- Civil Protection
- Urban planning
- Infrastructure and utilities
- Environmental services
- Port authorities
- Regional and national partners
It also lays the groundwork for future scenario modelling and digital twin integration.
A Small, Practical Pilot
The key thing is to start small, with a focused, low-risk pilot. For example:
- Select 2–3 priority hazards for which there is existing municipal documentation
- Generate interactive bow-tie diagrams
- Review findings internally with relevant teams
This can be completed quickly with no need for system replacement or organisational change. The goal is to enhance visibility fast, not add complexity.
From Documentation to Preparedness
This article does not propose adjusting, extending, or improving municipal risk documentation. It proposes making it more useful to risk professionals.
By structuring and visualising the contents of existing documents and data in a connected way, they can become more operationally useful — supporting clearer cross-department understanding and more effective preparation for situations that may emerge suddenly, with little warning and major impact.
In an era of climate variability and increasing system interdependence, automatically generated bow-tie diagrams show how risks connect and ripple out, clarifying the system effects of hazards. This not only helps professionals make better decisions – it also helps them explain their decisions, both to their colleagues and to their community.
Leave a Reply
You must be logged in to post a comment.